Visualisation of lifestyle activity information increases citizens’ awareness and promotes behavioural change.
The basic understanding of the Kashiwa ITS Smart City is that ITS is only a tool, and that the protagonists are the citizens of Kashiwa who use it. Citizens should take an interest in local traffic on a daily basis, be concerned about traffic congestion and the burden on the environment, and do what they can to alleviate or reduce it. The role of ITS is to support these citizens’ activities.
To this end, it is important to gather citizens’ interest, raise their awareness and make them realise that they can proactively change their transport behaviour… with information on their daily life activities. ITSs to date have also made use of various types of mobility and transport information. However, the information provided was often too technical and difficult to understand, and important information was often not fully utilised.
Kashiwa ITS Smart City’s main focus has been on how to communicate this information in a way that is easy for citizens to understand. For example, by modelling CO2, which is normally invisible, and showing it superimposed on the usual roads – so-called ‘visualisation’ – citizens become much more aware of it and are motivated to reduce it. In order to achieve this, it is important to generate complex and difficult information that is useful for everyday life from the perspective of citizens, and to communicate it in an easy-to-understand way so that it is perceived as an issue that is more familiar to them. We believe that information on daily life activities is only valuable if it is conveyed correctly to citizens.
Kashiwa Live Situation – a spatio-temporal content service that facilitates the transformation of living behaviour -.
In spatio-temporal information processing, which deals with temporal changes from the geographical requirements that constitute social space, the main area of discussion is the temporal history of geographical shapes and spatial attributes, and geographical information systems (GIS) that take temporal changes into account have also mainly managed the creation and disappearance times of geographical features.
On the other hand, as an important element in spatio-temporal information processing, image information, such as photographs, is also positioned as an important information medium. Image information is fast and highly visible, and images taken with a smartphone or other device equipped with a global positioning system (GPS) can be immediately associated with time and location information.
In recent years, with the advent of StreetView by Google and others, panoramic image content captured by omnidirectional cameras has also become generally recognised as image information that represents important social spaces.
Image information in GIS is used for a wide range of purposes, from images that represent the area under discussion, such as aerial photographs, to geographical attributes such as snapshots and videos. However, in conventional GIS, background images, snapshots and videos are registered through the GIS interface, which is not suitable for collecting information on social space in real time and immediately registering it as image information. In order to grasp the ever-changing situation, such as the situation of urban traffic, it is important to process information on the parts of the disputed area into images, add position and time attributes, and express them in an easy-to-understand manner for users in GIS and other systems. Furthermore, in order to accurately grasp the situation, it is necessary to have a system that simultaneously converts information obtained from multiple sensors into images and registers the data.
In addition to data registration, it is also important how the images are provided to the GIS side. If the data can be displayed in real time, and if the data can be stored as spatio-temporal traffic information and the history can be viewed, it can be useful as information necessary for decision-making in understanding and improving urban and regional traffic, for example, the possibility of road improvement through typological analysis of the landscape in congested areas and areas where accidents occur frequently. The data can be used for decision-making in understanding urban and regional traffic and implementing improvements.
In order to realise the real-time data registration and provision to GISs and other systems as described above, we propose a content service that is separate from the specific GIS. This service can provide images and the means of displaying them through the parameters of position and time, and enables information providers to flexibly assemble services according to the need for real-time image content taken for users.
■Kashiwa Live Situation (screen)
■Example of cooperation with Kashiwa Smart
Live Situation image content
Virtual transport experience using mixed reality technology – Seeing the present, past and future of urban activities in a ‘four-dimensional virtualised space’.
【Introduction.】
It is difficult to understand ‘city activity’ in distant places, in the past and in the future – road congestion can now be seen on maps thanks to VICS and other technologies, but it is difficult to get a sense of invisible SOx, NOx and CO2 emissions, or of congestion in public transport. The same applies to energy demand and supply, and the situation during disasters. For this reason, it is necessary to visualise information in an easy-to-understand manner.
【Mixed reality technology and four-dimensional virtualised space】
Mixed reality (MR) and virtual reality (VR) technologies are two promising technologies for visualisation: VR uses computer graphics (CG) to represent objects virtually, while MR presents CG overlaid on real scenery in an appropriate manner. The figure shows a representation of CO2 emissions and traffic flow using MR technology. When looking through a tablet device or goggle-type display, a screen like this is displayed. By linking the direction and content of the screen detected by the terminal’s sensors, the user can also look around freely.
MR technology can be used in various applications in the ITS field. These include car navigation, provision of information in times of disaster, disaster prevention education, and construction projections for roads and buildings. It can also be used to recreate lost cultural heritage and past towns on site, and is expected to be applied to the discovery of tourism resources and regional development. Furthermore, the Mixed Reality Mobility System we have developed allows multiple people to experience the city at the same time while travelling in combination with vehicles, and could be used to guide tourists and develop regional mobility.
Making various urban situations visible, both invisible and distant objects, past and future – we call such a system a ‘four-dimensional virtualised space’. This enables human judgement, awareness and new experiences.
【Towards reducing CO2 emissions.】
CO2 emissions from road traffic account for about 20% of the total, and there is an urgent need to reduce them. To achieve this, a system is needed to deepen understanding of CO2 emissions and environmental impact not only among car drivers but also among the general public as a whole, and to encourage them to take environmentally friendly traffic behaviour. To achieve this, the University of Tokyo’s Advanced Mobility Research Centre (ITS Centre), in collaboration with six private companies, is building a system that automatically generates and distributes ‘lifestyle traffic information’ to local citizens using a variety of technologies. The system estimates traffic conditions throughout the region based on traffic flows and statistical data observed from surveillance cameras and other sources, and calculates CO2 emissions. This is visualised using VR/MR technology and distributed to citizens’ information terminals. A social experiment is being conducted in Kashiwa City, Chiba Prefecture, to verify how the traffic behaviour of citizens is transformed.
KASHIWA SMART Website – Sustainable distribution of traffic information using existing media
The system provides the general public with easy-to-understand information on various lifestyle activities collected/generated by the sustainable road traffic information monitoring technology collected by existing roadside cameras and various sensors, and the ITS basic information system technology that supports the feedback loop that fuses/accumulates various types of traffic information, and distributes it using existing media, such as the The KASHIWA SMART system distributes information that encourages ‘awareness’ of traffic behaviour and ‘encouragement’ of behavioural change by distributing it via the Internet.
On the KASHIWA SMART website, visualised current and past CO2 emissions are distributed as information such as ‘CO2 Scope’, ‘CO2 emission status by road’ and ‘CO2 emission graph’. In addition, the KASHIWA SMA also distributes video content such as ‘virtualised space images’, which allow the public to visually see the CO2 emission status in CG form on actual road images, to inform the general public about the current CO2 emission status of the Kashiwa region, thereby providing information to make them ‘aware’ of traffic behaviour and encouraging changes in traffic behaviour.
On the KASHIWA SMART website, visualised current and past CO2 emissions are distributed as information such as ‘CO2 Scope’, ‘CO2 emission status by road’ and ‘CO2 emission graph’. In addition, the KASHIWA SMA also distributes video content such as ‘virtualised space images’, which allow the public to visually see the CO2 emission status in CG form on actual road images, to inform the general public about the current CO2 emission status of the Kashiwa region, thereby providing information to make them ‘aware’ of traffic behaviour and encouraging changes in traffic behaviour.
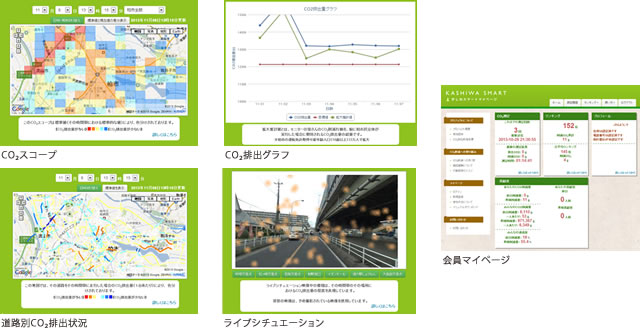
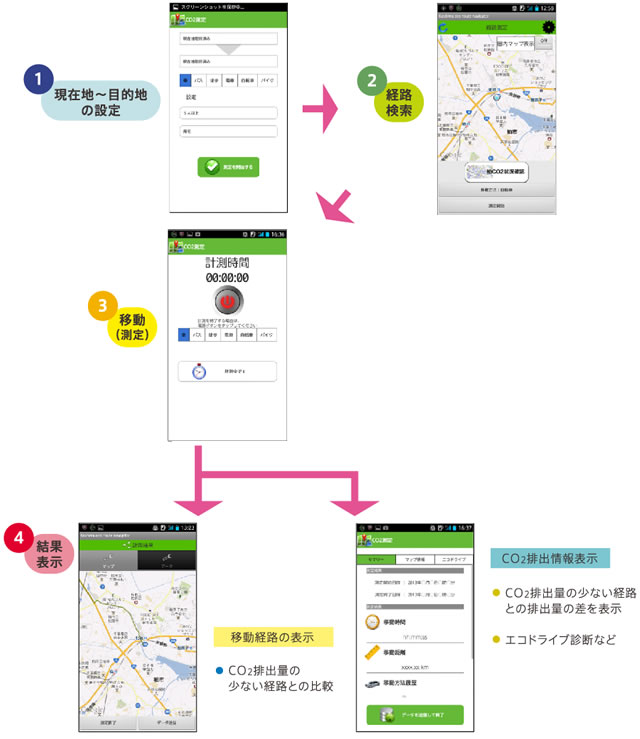
The KASHIWA SMART app has a route guidance function for travel within Kashiwa City and provides a route guidance service from the point of departure to the destination. This function uses simulations based on traffic information collected from existing roadside cameras and various sensors to calculate three different routes to the destination – the route with the lowest CO2 emissions, the route in the shortest time and the route in the shortest distance – and provides a service to guide users. In addition, by using the GPS function of the smartphone (Android) to record their own traffic behaviour, the amount of CO2 emitted by their own traffic behaviour is displayed and compared with the ‘route with the lowest CO2 emissions’ to inform users of the amount of CO2 that can be reduced, allowing them to look back after their traffic behaviour. The information is provided as a ‘nudge’ to change their behaviour towards less CO2 emissions-intensive traffic behaviour. KASHIWA SMART Website ⇒ http://www.kashiwa-smart.jp/
■The KASHIWA SMART app