Reproducing the “current” traffic situation in the region from various traffic data
In order to gain a detailed understanding of the actual traffic situation in the region and improve the accuracy of movement and traffic information, it is necessary to consolidate traffic information collected by various entities and monitor the ever-changing traffic situation from time to time from a bird’s eye view and in a comprehensive manner. However, simply collecting traffic information collected by various actors in various forms, such as ‘traffic volume data at point A’ or ‘data on the time required to travel from point B to point C’, does not provide a clear understanding of the actual traffic situation in the region ‘now’.
Moreover, even if a wide variety of traffic information is aggregated, there are limits to the information that can be collected, and it is not possible to collect data on congestion on all roads in the region. Therefore, for routes for which traffic information cannot be collected, it is necessary to be able to understand the actual traffic situation in some way.
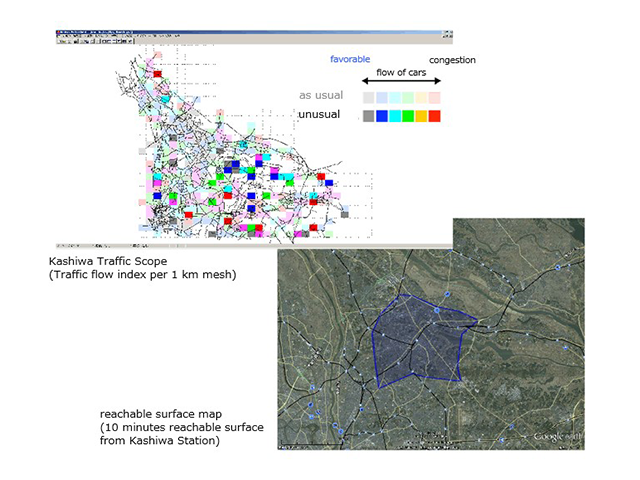
In the Kashiwa ITS Smart City, a basic system has been built to integrate traffic information collected at various time and spatial units to provide a bird’s eye view and comprehensive understanding of the entire region, and simulation technology has been developed to reproduce people’s traffic behaviour. This enables detailed traffic conditions to be reproduced for routes where traffic information can be collected, and for routes where traffic information cannot be collected, the traffic conditions can be estimated, making it possible to reproduce the actual traffic situation in the region ‘now’.
Integrated database of spatio-temporal traffic information – Information infrastructure for fusing overarching and comprehensive information on traffic conditions that change in time and space.
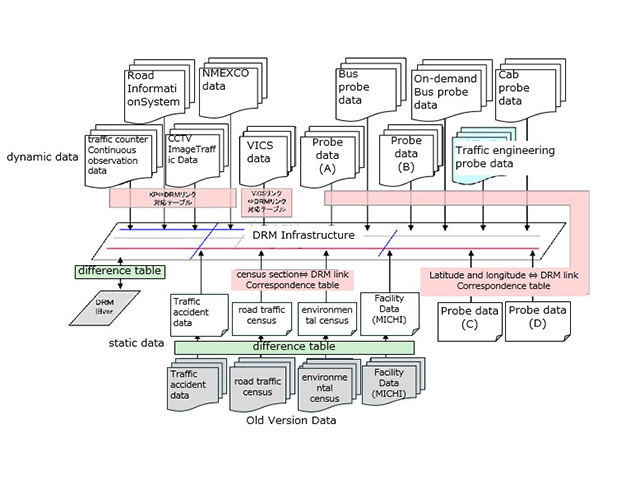
In order to integrate a wide range of different traffic data (point traffic volume, OD traffic volume, probe speed and travel time, etc.) and convert and store them into data that can easily be used as input for simulations, database technology has been developed to resolve differences in data content and cycles along spatial and temporal axes, and to ensure stable and The database technology has been developed to resolve differences in data content and cycles on the spatial and temporal axes to ensure stable and sustainable operation.
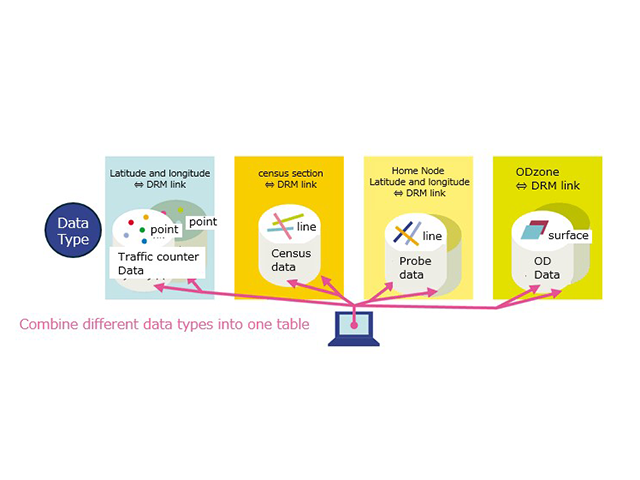
Spatial axis … data is harmonised between different spatial representation methods such as points, link units (lines) and meshes (planes).
Time axis … is managed in a version of the spatial axis (DRM links) to facilitate changes over time in multiple time cross-sections.
For example, there are multiple cross sectional traffic volume data, such as data from the Ministry of Land, Infrastructure, Transport and Tourism’s constant observation points and traffic volume data from roadside image sensors. In order to achieve format consistency of these cross-sectional traffic volume aggregation data, the data are integrated by assigning the year, month and type (1 = constantly observed, 2 = image sensor…). Furthermore, from the perspective of the spatial axis, the data is formatted for easy handling in Nowcast simulations by setting up sensor information keyed to the point ID and pre-registering the link ID corresponding to the latitude and longitude of the installation point.
As offline data, probe information from past ITS spots and probe data from Honda InterNavi, NRI Ubiquitous Link and other sources are integrated and accumulated, and used as basic data on a statistical basis for Nowcast simulations.
As online data, the following data are acquired and used to generate dynamic information for Nowcast simulations./p>
- ITS Spot road probess… Latitude and longitude information (excluding personally identifiable information) on the Kashiwa city area (5 mesh range) passed by ITS Spot-enabled vehicles from the Kanto Regional Development Bureau of the Ministry of Land, Infrastructure, Transport and Tourism.
- Number plate sensors… Passing OD traffic volume and travel time data in four sections and eight directions on National Routes 6 and 16.
- Trajectory data from apps… Trajectory information on travel by launching smartphone apps for citizens developed by the existing media distribution system.
This database consists of the following servers.
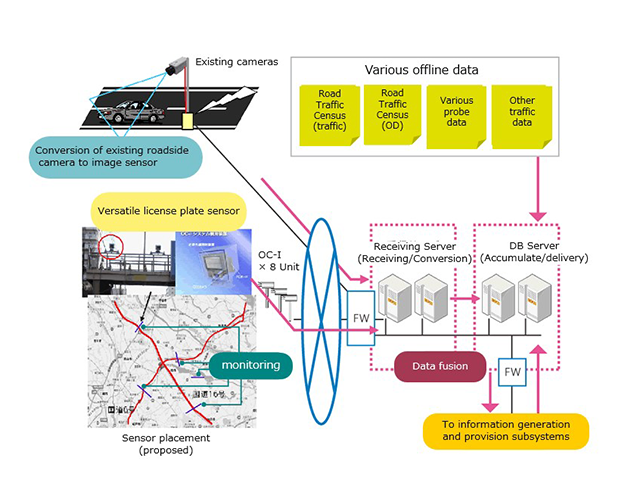
■Receiving server… Collects information from image sensors and number plate sensors from the roadsides in the Kashiwa City area and road probes from ITS spots online (FTP).
■DB server… Classification table common to the online data from the receiving server.
■Conceptual diagram of the integrated database of spatio-temporal traffic information
■Image of the integration of spatial axes
■System configuration (including related parts)
Kashiwa Nowcast traffic simulation – estimation of area traffic conditions by assimilating real-time traffic data and simulation models
For the purpose of evaluating various measures and ensuring the safe and smooth operation of road traffic, image and ultrasonic traffic volume and speed sensors have traditionally been installed on the roadside to monitor traffic conditions on major roads. In recent years, probe vehicle data, which obtains speed information from the location of passenger cars, taxis, buses and other commercial vehicles, has also been used.
However, these traffic data only observe a portion of the road traffic conditions spread over time and space, and it is not possible to know the conditions of routes where no roadside sensors were installed or where probe vehicles did not pass. It is also impossible to know indicators related to traffic as a whole, such as ‘how much CO2 is emitted from cars in the entire city of Kashiwa’.
The Kashiwa Nowcast Simulation is a technology that reproduces traffic conditions on a given day by incorporating various traffic data into a real-time traffic simulation. Specifically, the entire city of Kashiwa is divided into 1 km square meshes, and the calculation conditions are adjusted every 15 minutes so that the traffic flow conditions calculated by the simulation match the flow conditions known from observation data.
As driver behaviour and vehicle behaviour are modelled in the traffic simulation, the traffic conditions can be estimated for roads for which no observational data are available, provided that they are sufficiently consistent with the observed data.
This technology makes it possible to integrate and handle roadside sensor data and probe data with different measurement principles, enabling more efficient data utilisation. In addition, even in special circumstances, such as a major disaster, where roadside sensor data is not available and only probe data, which does not provide information on traffic volumes, can be used, it is still possible to estimate the traffic situation.
The Kashiwa Nowcast Simulation can output results for any road section or route, as well as results for each vehicle in the simulation. These results are used in the ‘Life Activity Information Generation System’ and various other services.
■Kashiwa Nowcast simulation video
■Example of Kashiwa Nowcast simulation output